
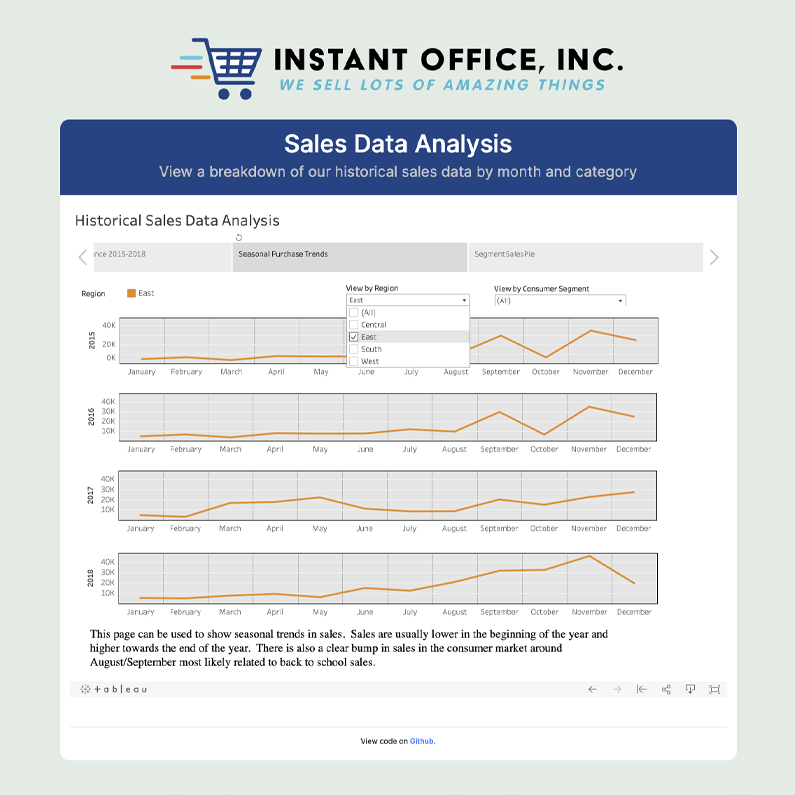
You're a regional sales manager at Instant Office, Inc. and you'd like to see your region's sales forecast for the next few months. This is a dashboard which includes sales forecast data, and an analysis of historical sales data to explore.
A group project — my part was the overall concept, creating the design and functionality of the website, the Flask App with API routes, creating a Postgres database, query the data, and setting up the API call. Teammates worked on the svg interactive charts, Tableau charts, and machine learning forecasting.
View Website Here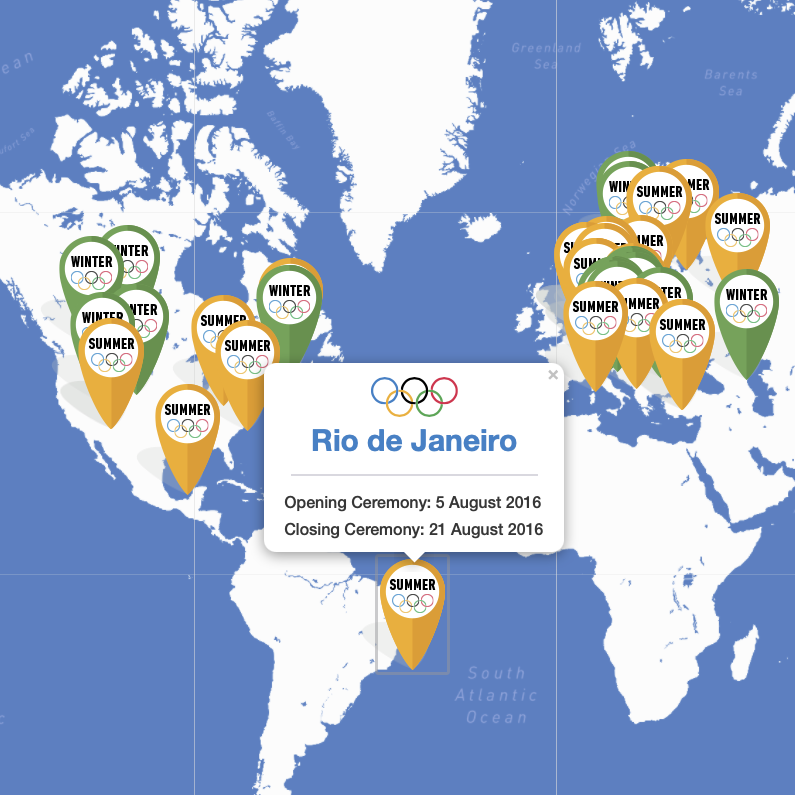
Fun data to explore — charting the recent Summer Olympic Games in Tokyo, creating an interactive dashboard, as well a map of all the host cities.
Uses D3.js, Plotly.js, Leaflet, and Mapbox.
View Website Here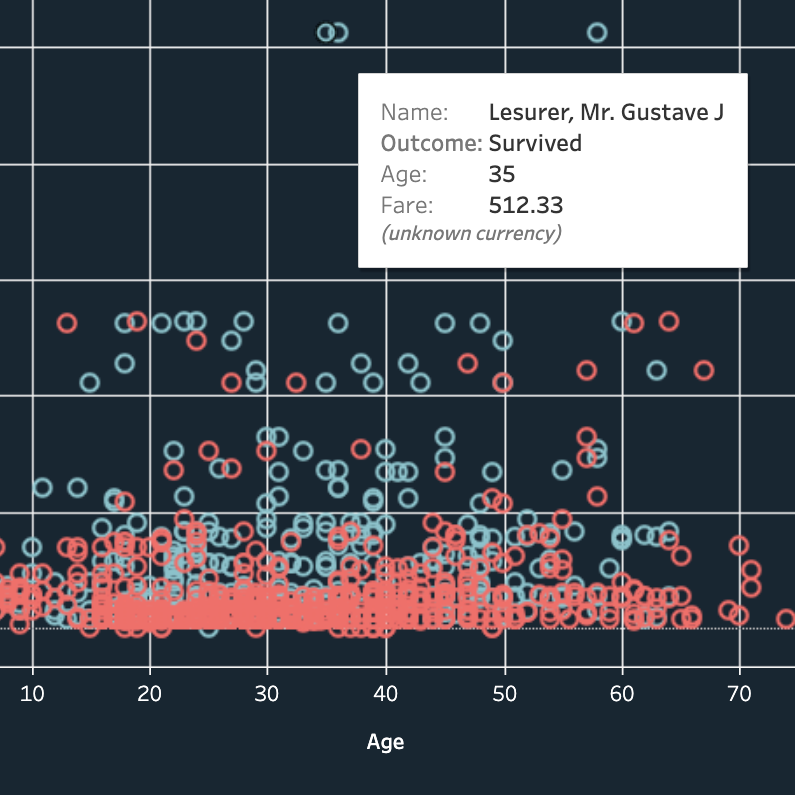
Using passenger data from a Kaggle.com data set I cleaned and supplemented the data using a few other sources. This dashboard breaks down survival rates based on factors like age, sex, and ticket class.
Created using Tableau Public.
View Website Here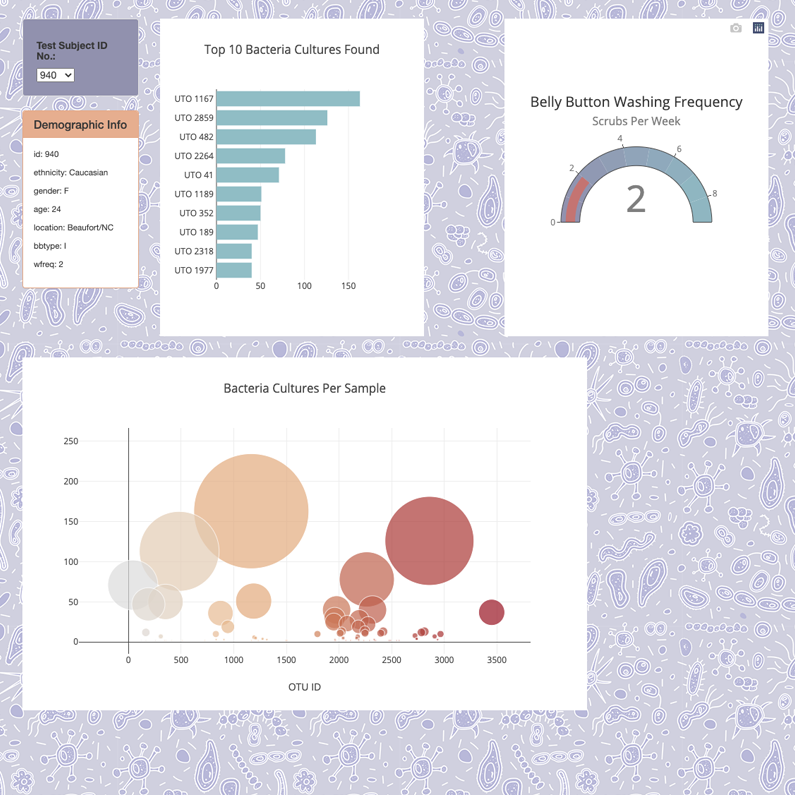
An interactive dashboard that charts Test Subjects' medical trial results documenting which microbes were present in their belly buttons.
Uses JSON format data, D3.js, Plotly.js, and JavaScript.
View Website Here
Loki has variants, do you? Inspired while watching an episode of the show Loki where the Time Variance Authority displays a few of his variants with id #s on screen, I wanted to create a fun website to mimic the show's idea of everyone having variants in the multiverse.
This fan site uses Tableau, Python, JavaScript and an API call to interact with data.
View Website Here